

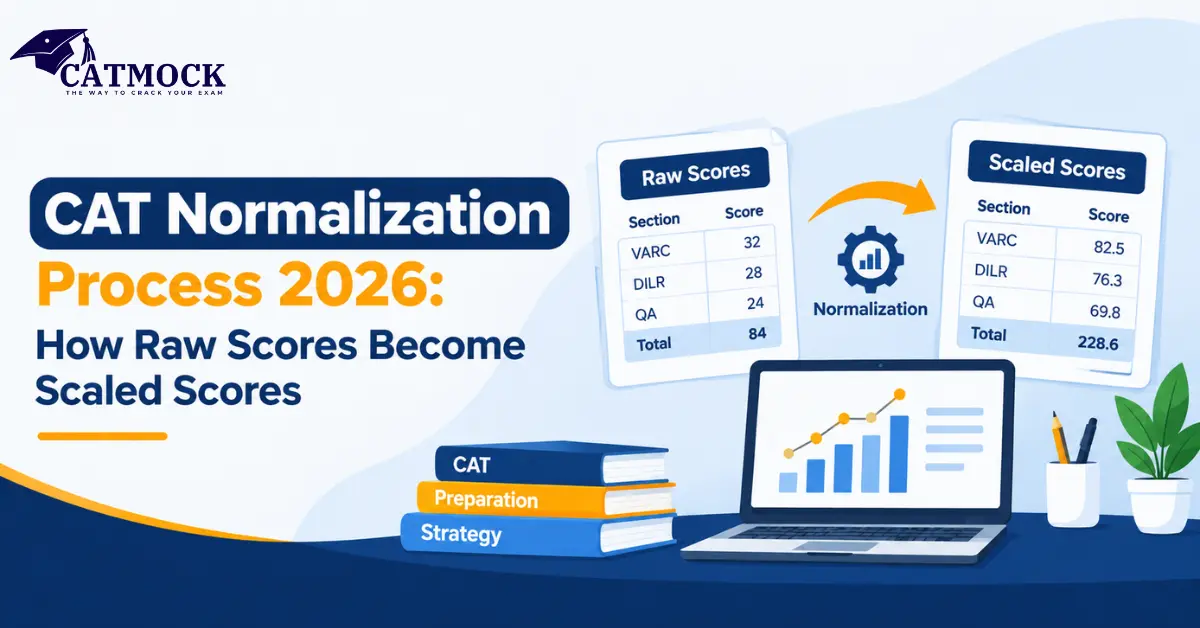
You finish the CAT, tally your answers, and estimate a raw score. Then someone tells you, “Wait for normalization; your score will change.” What does that actually mean?
The CAT normalization process is the statistical method IIMs use to make scores from different exam sessions comparable. It turns your raw marks into a scaled score, and only that scaled score is used to calculate your percentile. If you understand it, you will stop trusting random “marks vs percentile” guesses and start reading your mock results much more intelligently.
In this guide you will learn what normalization is, why it exists, how the two-stage process works, how the formula behaves, a worked example, common myths, and how to use this knowledge in your preparation.
What Is the CAT Normalization Process?
The CAT is held on a single day but in multiple sessions (slots). Each slot uses a different question paper. The Indian Institutes of Management design these papers to be equivalent, but perfect equality is nearly impossible. One slot may have a friendlier Data Interpretation set, another may have a trickier Quant section.
Normalization (also called scaling or equating) fixes this. According to the official IIM CAT information, candidates’ scores are subjected to normalization so that results from different sessions can be compared fairly. In simple words:
Normalization converts scores from different question papers onto one common scale, so your result reflects your ability, not your slot’s difficulty.
The exam pattern stays the same for everyone: 68 questions, 204 marks, +3 for a correct answer, −1 for a wrong MCQ, and no negative marking for TITA (non-MCQ) questions. Normalization does not change the pattern. It only adjusts the scores that come out of it.
Why Do IIMs Normalize CAT Scores?
Think of three students of identical ability. One gets a slightly harder paper, another an average one, and a third an easier one. Without adjustment, the third student would look “smarter” only because of luck. That is unfair, especially when a fraction of a percentile can decide an interview call.
Normalization exists for four reasons:
- Fairness across slots: A candidate in a tougher session should not be penalized.
- Comparability: CAT must rank lakhs of test-takers on a single, comparable scale.
- Statistical reliability: IIMs use established equating methods rather than guesswork.
- Transparency: A published scoring note explains the approach to candidates.
Because CAT conducts the exam in multiple sessions, each slot can have a different difficulty level. To understand how that variation plays out in real papers, read our detailed breakdown of CAT slot difficulty.
Raw Score, Scaled Score and Percentile: Know the Difference
Many aspirants mix these three terms up. Each one plays a separate role in the CAT scoring pipeline.
| Term | What It Means | Based On | Shown on Scorecard? |
|---|---|---|---|
| Raw Score | Marks from your own answers (correct × 3 minus wrong MCQs × 1) | Only your performance | No |
| Scaled Score | Raw score after slot-wise and section-wise normalization | Your score plus your slot’s statistics | Yes |
| Percentile | Your relative rank among all candidates | Scaled scores of everyone | Yes |
Two important takeaways:
- Your scaled score can be higher or lower than your raw score, depending on your slot’s difficulty.
- CAT calculates percentiles from scaled scores, not raw marks.
That is why a fixed “X marks = Y percentile” chart is only ever an approximation. If you want the ranking side of the story, we have explained it separately in how the CAT percentile is calculated, and you can see how ranges typically behave in our CAT score vs percentile guide.
The CAT Normalization Process Step by Step
The official note describes normalization as a two-stage activity. It first adjusts for differences across test forms (slots), and then across sections. Here is the full journey from your answer sheet to your scorecard.
| Stage | What Happens | Purpose |
|---|---|---|
| 1. Raw score calculation | Marks are counted for each section using the +3 / −1 / 0 scheme | Establish your base performance |
| 2. Session-wise statistics | Mean, standard deviation and top-performer averages are computed for each slot | Measure how each slot’s paper behaved |
| 3. Form-level normalization | Scores are adjusted for location and scale differences across slots | Make slots comparable |
| 4. Section-wise normalization | VARC, DILR and QA are scaled so that sections are on a common scale | Prevent one section from distorting the total |
| 5. Total scaled score | Sectional scaled scores are combined into an overall score | Create your final scaled score |
| 6. Percentile conversion | Scaled scores are converted into percentiles | Rank candidates on a common scale |
Stage 1: Adjusting for Location and Scale Across Slots
Two words matter here: location and scale.
- Location refers to where the bulk of scores sits (for example, the average). If one slot’s average is lower because the paper was tougher, its scores get shifted upward.
- Scale refers to how spread out the scores are (the standard deviation). If one slot has a tighter or wider spread, the scores are stretched or compressed to match.
The official note states that this adjustment happens across different forms of the test, so that the same ability lands on the same scaled value whatever the slot.
Stage 2: Adjusting Across Sections
After the slot-level adjustment, the normalization process adjusts scores separately for Verbal Ability and Reading Comprehension (VARC), Data Interpretation and Logical Reasoning (DILR), and Quantitative Ability (QA). It treats each section independently because a slot can have an easier VARC section and a tougher DILR section at the same time. The scorecard then displays your sectional and total scaled scores along with your percentiles.
This is why you cannot simply add up “adjusted totals” at home. Every section carries its own adjustment.
Understanding the CAT Normalization Formula
IIMs publish the approach, but the exact numbers depend on the actual data of that year’s exam. Widely published explanations describe a formula of this type (similar in spirit to the method used in other multi-session national exams):
Scaled Score = [(M_t − M_q) ÷ (M_it − M_iq)] × (Raw Score − M_iq) + M_q
Here is what each symbol represents:
| Symbol | Meaning |
|---|---|
| M_t | Average of the top 0.1% of candidates across all slots |
| M_q | Combined measure (mean + standard deviation) of all candidates across all slots |
| M_it | Average of the top 0.1% of candidates in your slot |
| M_iq | Combined measure (mean + standard deviation) of candidates in your slot |
| Raw Score | Your marks in that section |
Read the formula in plain English:
- Find how far your raw score sits from your slot’s benchmark (Raw Score − M_iq).
- Multiply it by a stretch factor. This factor compares the overall “top-to-typical” gap with your slot’s gap.
- Add the overall benchmark back (M_q).
If your slot was tougher, the slot’s benchmarks (M_it and M_iq) are lower, the stretch factor grows, and your scaled score rises. If your slot was easier, the opposite happens. Please treat this as a conceptual model: refer to the official scoring and equating note for the exact parameters used in the exam year.
Worked Example: Same Raw Score, Different Slots
Let’s use hypothetical numbers to see the effect. These are not real CAT values.
Assume the overall benchmarks are M_q = 60 and M_t = 140.
| Detail | Candidate A (Tougher Slot) | Candidate B (Easier Slot) |
|---|---|---|
| Slot benchmark (M_iq) | 52 | 68 |
| Slot top-0.1% average (M_it) | 128 | 152 |
| Raw section score | 70 | 70 |
| Stretch factor (80 ÷ slot gap) | 80 ÷ 76 ≈ 1.05 | 80 ÷ 84 ≈ 0.95 |
| Calculation | (70 − 52) × 1.05 + 60 | (70 − 68) × 0.95 + 60 |
| Scaled score | ≈ 79 | ≈ 62 |
Both candidates scored the same raw marks. Yet Candidate A, who faced the harder paper, ends up with a substantially higher scaled score, and a higher percentile as a result. This is exactly the fairness that normalization is designed to deliver.
Real data is far more complex, but the logic is the same: a tough slot lifts scores, and an easy slot tempers them.
Common Myths About CAT Score Normalisation
Misunderstandings spread fast on social media and preparation groups. Let’s clear the most common ones.
| Myth | Reality |
|---|---|
| “A tough slot always gives a higher percentile.” | Not necessarily. Normalization compensates for difficulty; it doesn’t hand out bonuses. Your relative performance still matters. |
| “I can choose the best slot.” | The slot is allotted by the conducting IIM. You cannot pick it or game it. |
| “Normalization changes the marking scheme.” | No. The +3 / −1 / 0 scheme is unchanged. Only the resulting scores are adjusted. |
| “Raw score decides my percentile.” | Percentiles come from scaled scores, not raw marks. |
| “There is a magic conversion chart.” | Any chart is an estimate. Actual values change every year with the paper and candidate pool. |
| “Normalization only matters for top scorers.” | It affects every candidate, though the impact varies by slot and section. |
Bottom line: normalization is a fairness tool, not a lottery. Your best strategy is unchanged: maximize accuracy and attempt quality in every section.
How to Use This Knowledge in Your Preparation
Understanding the CAT normalization process should change how you prepare, not whether you prepare.
- Stop obsessing over slot luck. You cannot control the paper you get. You can control your accuracy, selection of questions and time management.
- Analyze mocks by percentile trend, not raw marks. A quality mock series compares you with a large candidate pool, which mimics the logic of normalization.
- Track sectional balance. Because each section is scaled separately, a weak section can hurt your total even if the others are strong.
- Do not calculate your “final score” from raw marks. Use estimation as a rough guide only. Official percentiles will be based on scaled scores.
- Keep your mind calm on exam day. If the paper feels tough, remember that everyone in your slot faces the same paper, and normalization accounts for that. Anxious second-guessing costs more marks than any tough section; our guide on overthinking in the CAT exam shows how to stay composed.
- Know what comes next. Once scaled scores and percentiles are ready, the results are published. See our overview of the CAT result for what your scorecard contains.
Summary
- The CAT normalization process adjusts scores across exam slots so that no candidate gains or loses because of paper difficulty.
- It works in two stages: normalization across forms (slots), then across sections (VARC, DILR, QA).
- Your raw score is converted into a scaled score, and your percentile is based on the scaled score.
- The formula compares your slot’s statistics with the overall statistics, stretching or shifting scores as needed.
- A tougher slot generally lifts scores; an easier slot tempers them, but your relative performance still decides the outcome.
Frequently Asked Questions (FAQs)
1. What is the CAT normalization process?
It is the statistical method IIMs use to adjust raw scores from different exam slots onto a common scale. The result is a scaled score that allows fair comparison of all candidates.
2. Why is normalization needed in CAT?
CAT conducts the exam in multiple sessions using different question papers. Because the difficulty level can vary slightly, the normalization process ensures that your slot does not give you an unfair advantage or disadvantage.
3. Is the CAT percentile calculated from raw marks or scaled scores?
From scaled scores. Raw marks are only the starting point. For the full ranking logic, see our article on how CAT percentile is calculated.
4. Can my scaled score be lower than my raw score?
Yes. If you take an easier slot, the normalization process may adjust your scaled score downward. If you take a tougher slot, it may adjust your score upward.
5. Does normalization apply to each section separately?
Yes. After adjusting scores across slots, the normalization process also adjusts them across VARC, DILR, and QA. As a result, the scorecard shows sectional and total scaled scores.
6. Can I choose my CAT slot to benefit from normalization?
No. The conducting institute assigns the slots, and the normalization process ensures that your assigned slot does not affect your fair standing.
7. Will the CAT 2026 normalization process be different?
Core principle of normalizing scores—first across slots and then across sections—remains the same, you should still check the latest official CAT 2026 notification to stay updated.
Conclusion
The CAT normalization process isn’t something to fear or outsmart. It is a statistical safeguard that makes sure a candidate’s result reflects their ability, not the mood of the question paper. Your raw score is just the starting line. The scaled score, built from slot-wise and section-wise adjustments, is what truly shapes your percentile.
So focus on what you can control: solid concepts, smart question selection, accuracy and a calm mind. Use mocks to measure your standing against a large candidate pool, keep the official CAT website bookmarked for scoring updates, and trust that the system is built to compare you fairly. Prepare well, and let normalization do its job.
You May Also Like : CAT MOCK, CAT MOCK PYQ
Follow Us On : Facebook, Instagram, Youtube