
Picture two students on day one of an analytics MBA. One opens a dataset and feels lost, while the other writes a quick query and spots a pattern in minutes. The difference is rarely intelligence. It is preparation.
If you are targeting an MBA in Business Analytics in 2027, the months before joining are your biggest advantage. B-school moves fast, and professors expect you to pick up concepts quickly. Students who already have the basics spend their time on strategy and real projects, while others spend it catching up.
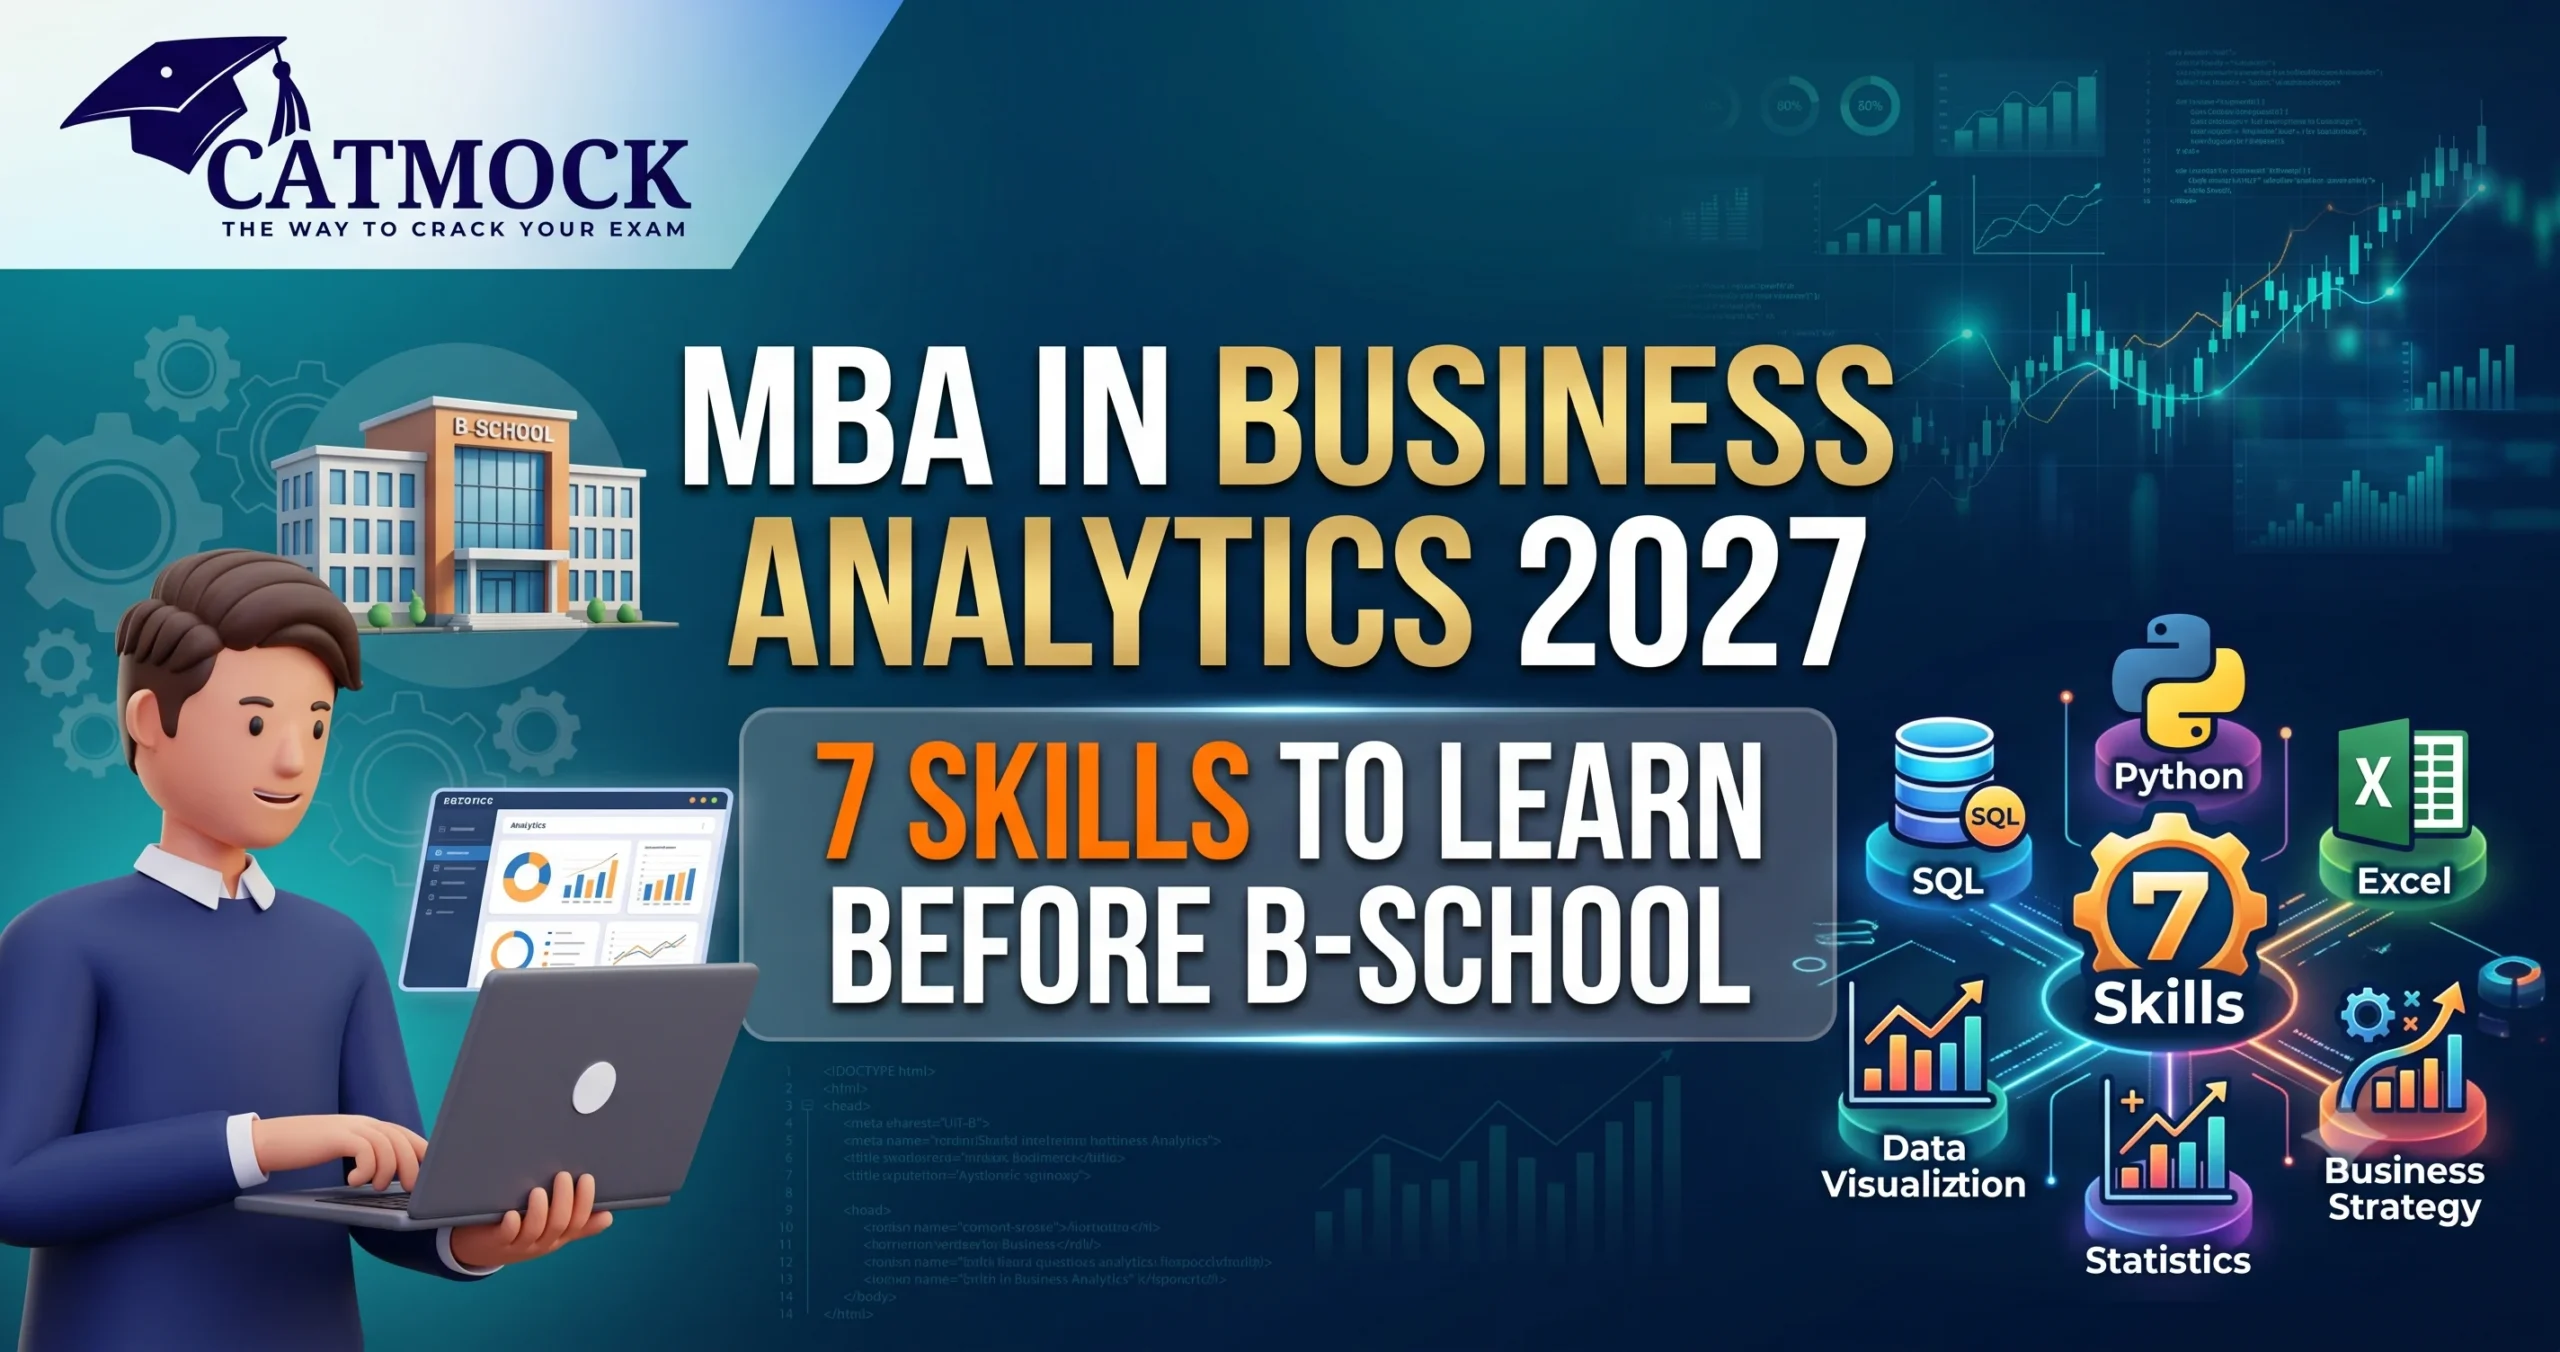
This guide covers the 7 skills to learn before B-school, the tools to use for each, how deep to go and a simple month-by-month roadmap. You do not need to become a data scientist. You need a solid foundation.
Why Pre-MBA Preparation Matters for Business Analytics
Analytics has moved from a niche specialisation to a core business function. Companies in retail, banking, healthcare, e-commerce and manufacturing use data to guide pricing, customer targeting, supply chains and risk decisions.
B-schools have responded by adding analytics to their curricula, and some run data-analysis primers before the program begins to bring everyone to a common baseline. A QS Intelligence Unit and Clear Admit survey also found that most prospective business school candidates expect to build analytics skills, with SQL, R and Python among the languages they most wanted exposure to.
That is the key point: B-school will teach you analytics, but it will not wait for you. Arriving with the basics lets you:
- Follow technical classes without panic
- Spend more time on case studies and projects
- Compete more confidently for internships
- Build a stronger resume and interview story
Good news if you have a non-technical background: an analytics MBA does not usually demand deep programming expertise on day one. Coding helps, but the sharper edge is combining data skills with business thinking.
MBA in Business Analytics: What You Will Actually Study
Before choosing skills, know what the program typically covers. Most business analytics MBAs include:
- Statistics and quantitative methods
- Data management and databases
- Descriptive, predictive and prescriptive analytics
- Data visualisation and business intelligence
- Marketing, finance and operations analytics
- Projects, case studies and industry exposure
The 7 Skills at a Glance
7 Skills to Learn Before an MBA in Business Analytics
| # | Skill | Why it matters | Key tools | Target level before B-school |
|---|---|---|---|---|
| 1 | Excel and spreadsheet modelling | Foundation for analysis and case work | Excel, Google Sheets | Intermediate |
| 2 | Statistics and probability | Basis of every analytics method | Excel, basic Python or R | Solid fundamentals |
| 3 | SQL and database basics | Extracts and combines business data | MySQL, PostgreSQL | Comfortable with core queries |
| 4 | Python (or R) for data analysis | Automates analysis and builds models | Python with pandas, or R | Beginner to intermediate |
| 5 | Data visualisation and BI | Turns data into decisions | Power BI, Tableau | Build a working dashboard |
| 6 | Business acumen and problem framing | Connects analysis to real decisions | Case practice, business news | Strong working knowledge |
| 7 | Data storytelling and communication | Persuades stakeholders | Slides, written briefs | Clear and confident |
Now let us go through each one.
Skill 1: Excel and Spreadsheet Modelling
Excel remains the most widely used analytics tool in business. Many MBA assignments, case studies and corporate tasks still begin and end in a spreadsheet.
What to learn:
- Formulas such as lookups, conditional logic and text functions
- Pivot tables and pivot charts
- Data cleaning: removing duplicates, fixing formats, handling blanks
- Basic financial modelling and scenario analysis
- What-if tools, such as goal seek and data tables
How to practise: Download a public dataset and answer five business questions using only Excel. Try questions like “Which product category drives the most profit?” or “Which month shows peak demand?”
Target level: You should be able to clean a messy dataset and build a summary dashboard without help.
Skill 2: Statistics and Probability
Statistics is the engine behind analytics. Without it, you risk reading patterns that are not really there.
What to learn:
- Mean, median, variance and standard deviation
- Probability and distributions, especially normal and binomial
- Sampling and confidence intervals
- Hypothesis testing, including p-values and basic A/B testing
- Correlation versus causation
- Introductory regression
Why it matters: Predictive modelling, forecasting and experimentation all rest on these ideas. Analytics courses in B-school often build on them quickly.
How to practise: Take a real question, such as “Did a discount actually increase sales?”, and test it with a hypothesis test, then write a one-paragraph conclusion in plain language.
Target level: You should be able to explain, without jargon, what a p-value tells you and what it does not.
If you are also preparing for entrance exams, revising quantitative concepts now will pay off twice.
Skill 3: SQL and Database Basics
Most business data lives in databases, and SQL is how you get it out. It is one of the most commonly requested analytics skills and one of the easiest to learn.
What to learn:
- SELECT, WHERE, GROUP BY, ORDER BY
- Joins across multiple tables
- Aggregations such as SUM, COUNT and AVG
- Subqueries and basic window functions
- How relational databases are structured
How to practise: Install a free database such as PostgreSQL, load a sample sales dataset and write queries answering real questions, like top customers by revenue or monthly growth by region.
Target level: You should be comfortable combining two or three tables to answer a business question.
Skill 4: Python (or R) for Data Analysis
Coding is not mandatory for every analytics MBA, but it widens your opportunities. Python is usually the friendliest starting point for beginners.
What to learn:
- Basic syntax: variables, loops, functions
- Data handling with libraries such as pandas
- Cleaning and transforming data
- Simple charts with Matplotlib or similar libraries
- An introduction to machine learning concepts, such as classification and regression
You can download Python from python.org and practise with open datasets from Kaggle or India’s open government data portal.
Python or R? Choose one and go deeper rather than splitting your effort. Python is more common in industry, while R is strong in statistics and academia.
Target level: You should be able to load a dataset, clean it, summarise it and produce two or three clear charts.
Skill 5: Data Visualisation and Business Intelligence
A brilliant analysis fails if nobody understands it. BI tools help you build interactive dashboards that managers can use.
What to learn:
- Choosing the right chart for the right question
- Building dashboards in Power BI or Tableau
- Using filters, slicers and drill-downs
- Avoiding misleading visuals
- Designing for clarity, not decoration
How to practise: Create a one-page dashboard for a fictional retail business showing sales, profit, top products and regional performance. Then ask a friend to explain what it says without your help. If they cannot, simplify it.
Target level: You should be able to build a clean dashboard that answers a manager’s question in under a minute.
Skill 6: Business Acumen and Problem Framing
This is the skill that separates an analyst from a business leader. Knowing how to run a query is useful, but knowing which question to ask is what an MBA rewards.
What to learn:
- Basics of accounting and finance: revenue, margins, cash flow
- Marketing fundamentals: segmentation, pricing, customer lifetime value
- Operations: inventory, supply chain, capacity
- How to turn a vague problem into a testable question
- Reading business news with an analytical eye
How to practise: Pick a company and ask, “If I had its data, what three decisions could I improve?” Write down the data you would need and the metric you would track.
Target level: You should be able to translate a business problem into a clear analytics question.
Business acumen is also what interviewers test.
Skill 7: Data Storytelling and Communication
Numbers do not speak for themselves. Your job is to give them meaning.
What to learn:
- Structuring an insight: context, finding, implication, recommendation
- Writing short, clear summaries for non-technical readers
- Presenting charts with a single message each
- Handling questions and challenges calmly
How to practise: Take one of your Excel or SQL analyses and present it in three slides: the problem, the key finding and the recommended action. Time yourself and aim for two minutes.
Target level: You should be able to present a finding to someone with no technical background and make them act on it.
How the Skills Connect to Real Career Roles
Different roles lean on different skills. Use this table to align your preparation with your goal.
Skill Emphasis by Analytics Career Path
| Career path | Top skills to emphasise | Typical work |
|---|---|---|
| Business analyst | Excel, SQL, business acumen, storytelling | Requirements, reporting, process improvement |
| Data analyst | SQL, Python, visualisation, statistics | Cleaning data, building dashboards, insights |
| Marketing analyst | Statistics, visualisation, business acumen | Campaign performance, customer segmentation |
| Financial analyst | Excel, statistics, business acumen | Forecasting, budgeting, risk analysis |
| Analytics consultant | Storytelling, business acumen, visualisation | Solving client problems with data |
| Product or operations analyst | SQL, statistics, Python | Metrics, experimentation, process optimisation |
You do not need to master all seven at the same depth. Choose two or three to go deeper on, based on your preferred path.
A 6-Month Roadmap Before You Join B-School
If you are applying for the 2027 intake, you likely have several months between now and the program start. Here is a realistic plan at about 6 to 8 hours per week.
Pre-MBA Skill-Building Roadmap
| Month | Focus | Milestone |
|---|---|---|
| Month 1 | Excel fundamentals and data cleaning | Clean a dataset and build a pivot summary |
| Month 2 | Statistics and probability | Complete a hypothesis test on real data |
| Month 3 | SQL basics and joins | Answer 15 business questions with queries |
| Month 4 | Python basics with pandas | Analyse a dataset and plot three charts |
| Month 5 | Power BI or Tableau | Publish a one-page dashboard |
| Month 6 | Business cases, storytelling and a mini project | Present a 3-slide analysis from data you collected |
If you are also preparing for entrance exams, run the roadmap alongside them but reduce the weekly hours during peak exam weeks.
Build a Portfolio, Not Just a Certificate
Certificates show you studied, while projects show you can do. Aim for two or three small projects, such as:
- Sales analysis: Clean a retail dataset in Excel or SQL and report on profitability.
- Customer segmentation: Group customers by behaviour using Python and explain the segments.
- Dashboard project: Build a Power BI or Tableau dashboard for a business you know.
Store them in a short portfolio or document, with a one-line problem statement, your method and the result. These projects also give you strong material for interviews and internship applications.
Common Mistakes to Avoid
- Learning too many tools at once. Go deep on a few before widening.
- Skipping statistics. Tools without theory lead to wrong conclusions.
- Collecting certificates with no projects. Practical proof matters more.
- Ignoring business context. A technically perfect analysis that answers the wrong question has no value.
- Neglecting communication. If people cannot understand your insight, it will not be used.
- Waiting until the MBA starts. Early momentum makes the first semester far easier.
- Chasing advanced AI topics too early. Master fundamentals first.
Do You Need a Technical Background?
Not necessarily. Many analytics MBA students come from commerce, arts, management or engineering backgrounds. Programs usually admit through their regular MBA or PGDM selection process, and strong aptitude plus a willingness to learn matters. What helps is showing steady, practical effort: a few projects, some coding comfort and clear career goals.
If you come from a non-technical field, focus first on Excel, statistics and SQL. Add Python once those feel comfortable.
Summary
- Pre-MBA preparation lets you spend B-school time on strategy and projects instead of catching up on basics.
- The 7 skills are Excel, statistics, SQL, Python or R, data visualisation, business acumen and data storytelling.
- Aim for working proficiency in each, not expert level.
- Choose two or three to deepen based on your target career path.
- Follow a 6-month roadmap and build two or three small projects for your portfolio.
- Coding helps but is not always mandatory, while business thinking and communication are essential.
- Avoid learning too many tools at once or collecting certificates without applying them.
Frequently Asked Questions (FAQs)
1. What skills should I learn before an MBA in Business Analytics?
Focus on Excel, statistics, SQL, Python or R, data visualisation, business acumen and data storytelling. Together they cover both technical ability and business thinking.
2. Is coding required for an MBA in Business Analytics?
Not always. Many programs teach coding from scratch, but knowing basic Python or SQL gives you a head start and widens your career options.
3. Can a non-technical student pursue an MBA in Business Analytics?
Yes. Students from commerce, arts and management backgrounds enrol regularly. Build basics in Excel, statistics and SQL to prepare.
4. Which is better to learn first: Python or SQL?
For most beginners, Excel and SQL come first because they are quicker to learn and widely used. Python follows once you are comfortable with data basics.
5. How long does it take to prepare before B-school?
Around six months at 6 to 8 hours a week is enough to build working proficiency in the core skills. Shorter timelines work if you focus on fewer skills.
6. How much statistics do I need?
Know descriptive statistics, probability, hypothesis testing and basic regression. You should understand what the results mean, not only how to calculate them.
7. Should I learn Power BI or Tableau?
Either is fine. Choose one, build a dashboard and focus on clear design. The skill transfers across tools.
8. Do certificates help for admissions?
They can show initiative, but projects and clear career goals matter more. A small portfolio of real analyses makes a stronger impression.
9. Is business analytics different from data science?
Business analytics focuses on using data to solve business problems and support decisions, while data science often goes deeper into algorithms and engineering. There is overlap, so check each program’s curriculum.
10. When should I start preparing for the 2027 intake?
Start now. Early preparation reduces pressure and lets you build projects before applications and interviews.
Conclusion
An MBA in Business Analytics in 2027 can open doors across industries, but the students who gain the most are the ones who prepare early. Learn Excel, statistics, SQL, Python, visualisation, business acumen and storytelling, and you will walk into B-school ready to learn faster and contribute sooner.
Start small. Pick one skill this week, set a modest goal and build a first mini project. In six months you will have a portfolio, stronger confidence and a clear edge. The best time to prepare is before the first lecture, and that time is now.
You May Also Like : CAT MOCK, CAT MOCK PYQ
Follow Us On : Facebook, Instagram, Youtube