

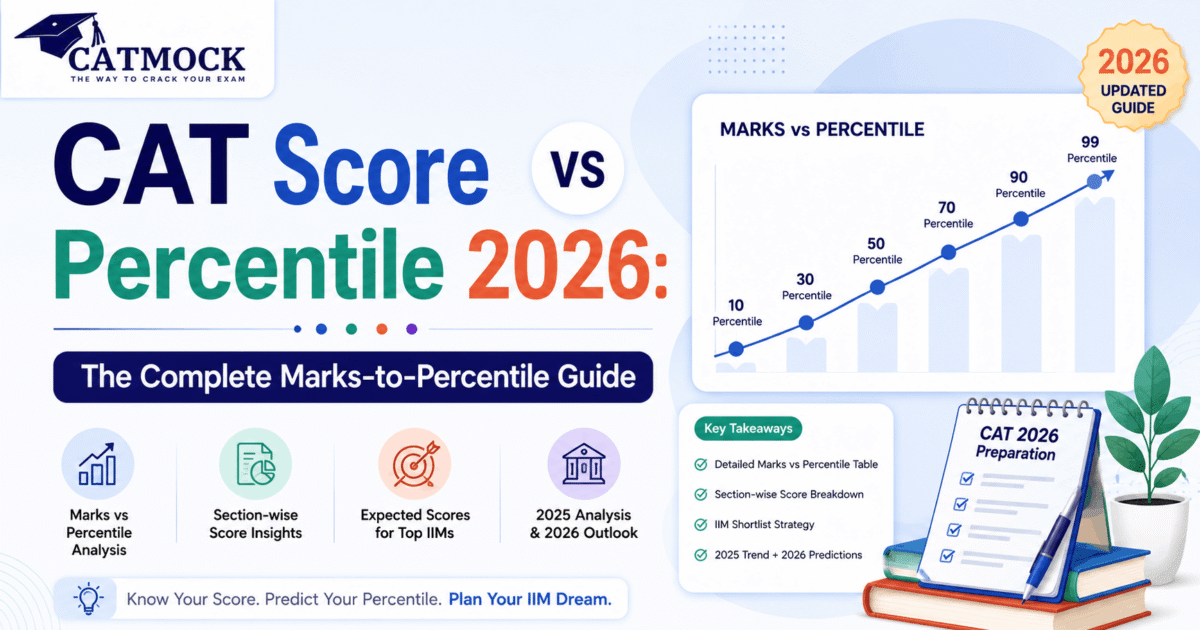
Every December, thousands of CAT aspirants walk out of the exam hall running the same mental math: “I think I scored around 60 marks — is that a 95 percentile or a 99 percentile?” The honest answer is that nobody can tell you with certainty on exam day, and that uncertainty is precisely why the relationship between CAT Score vs Percentile 2026 confuses even well-prepared candidates.
The confusion isn’t a knowledge gap — it’s a structural feature of how CAT is scored. Your CAT marks are not directly converted into a percentile. There’s an entire normalization process sitting between the two. Understanding that process is the difference between setting a realistic target and chasing a number that has no real predictive value.
This guide breaks down exactly how CAT Marks vs Percentile 2026 estimates are built, how last year’s CAT Score vs Percentile 2025 data can inform your preparation, and what marks range you should realistically aim for across VARC, DILR, and QA.
What Is CAT Score? Raw Score vs Scaled Score
Before percentile even enters the picture, your performance passes through two distinct scoring stages.
Raw Score
Your raw score is the straightforward sum of your correct and incorrect answers, calculated using CAT’s standard marking scheme: +3 for every correct answer, -1 for every incorrect MCQ, and 0 for unattempted questions or incorrect Type-In-The-Answer (TITA) responses, which carry no negative marking. This raw score is what most candidates mentally calculate immediately after the exam — and it’s also the number your official scorecard will never actually display.
Scaled Score
Because CAT runs across multiple slots in a single day, and no two slots present a paper of identical difficulty, the exam authority applies a normalization process. This process converts your raw score into a scaled score that accounts for the specific difficulty of your slot relative to other slots. A candidate who draws a genuinely harder paper isn’t penalized for that scheduling luck — their raw performance is adjusted upward to compensate. It is this scaled score, not the raw score, that ultimately determines your percentile.
What Is CAT Percentile?
Percentile is a purely relative measure. It tells you what proportion of that year’s test-takers you outperformed, based on your scaled score. A 99 percentile means you scored higher than 99% of all candidates who appeared for CAT that year — it says nothing, by itself, about how many marks you actually got. This is why the same scaled score can translate into different percentiles across two different years: percentile depends as much on the overall candidate pool’s performance as it does on your own.
CAT Score vs Percentile 2026: Key Differences at a Glance
| Parameter | CAT Score (Marks) | CAT Percentile |
|---|---|---|
| Definition | Points earned based on correct/incorrect answers, later normalized | Relative rank compared to all test-takers |
| Nature | Absolute number (scaled) | Relative statistic (0–100 scale) |
| Displayed on Scorecard? | Yes (scaled score only, not raw) | Yes |
| Affected by Paper Difficulty? | Yes, adjusted through normalization | Indirectly, via normalized scores |
| Used by IIMs for Shortlisting? | Rarely used directly | Yes, primary shortlisting criterion |
| Changes Year to Year? | Yes, based on difficulty level | Recalculated relative to that year’s pool |
How Normalization Works in CAT 2026
Normalization exists to solve one core fairness problem: multiple slots, unequal difficulty. Here’s a simplified view of how the process typically flows.
| Step | What Happens |
|---|---|
| 1. Raw Score Calculation | Marks tallied using +3/-1/0 scheme per section |
| 2. Slot Difficulty Assessment | Each slot’s overall performance and difficulty is statistically compared |
| 3. Scaled Score Conversion | Raw scores are adjusted into scaled scores using an equipercentile method |
| 4. Percentile Computation | Scaled scores across all slots are ranked to generate percentiles |
| 5. Sectional + Overall Percentile | Percentiles are calculated separately for VARC, DILR, QA, and overall |
You can review the official normalization policy and download scorecards directly from the CAT exam authority’s website.
The practical implication for CAT Score vs Percentile 2026 planning is simple: don’t fixate on a single “magic number.” Because normalization shifts every year depending on paper difficulty and the size of the applicant pool, the marks needed for a given percentile move up or down annually — sometimes significantly.
CAT Score vs Percentile 2026: Expected Marks Table
Based on early 2026 trend estimates and historical patterns, here is an indicative marks-to-percentile mapping. These figures are projections, not guarantees, and will shift once the actual exam difficulty and candidate performance data are available.
| Target Percentile | Estimated Scaled Score (2026) | Competitiveness Level |
|---|---|---|
| 99.9 percentile | ~110–125 marks | Top IIM (A/B/C) territory |
| 99 percentile | ~83–90 marks | Strong IIM shortlist range |
| 95 percentile | ~55–65 marks | Good B-school range |
| 90 percentile | ~51–53 marks | Decent regional B-school range |
| 80 percentile | ~35–42 marks | Entry-level MBA programs |
Note: These are early estimates based on historical trend modeling, not official IIM data. Actual CAT 2026 score-percentile mapping will only be confirmed once results are declared.
CAT Marks vs Percentile 2026: Section-Wise Breakdown
A common mistake aspirants make is optimizing only for the overall score while ignoring sectional cutoffs. Most IIMs apply independent cutoffs for VARC, DILR, and QA — a strong overall percentile means little if one section falls below the threshold.
| Section | Estimated Marks for 99 %ile | Estimated Marks for 95 %ile | Estimated Marks for 90 %ile |
|---|---|---|---|
| VARC | ~28–32 | ~18–22 | ~13–16 |
| DILR | ~26–30 | ~16–19 | ~11–14 |
| QA | ~30–34 | ~20–24 | ~14–17 |
CAT Score vs Percentile 2025: Last Year’s Actual Data
Looking at confirmed CAT Score vs Percentile 2025 figures gives the clearest anchor point for 2026 planning, since it reflects real candidate performance rather than projections.
| Percentile (2025) | Overall Scaled Score |
|---|---|
| 99.90 percentile | ~111.4 |
| 99 percentile | ~85–86 |
| 95 percentile | ~52–58 |
| 90 percentile | ~46–50 |
The CAT 2025 data reinforces a pattern seen across recent years: the marks required for a 99 percentile rarely exceed 90–95, even though many candidates assume they need to cross 120–130 marks. This gap between perception and reality is one of the biggest reasons aspirants misjudge their own preparation targets.
5-Year Trend: CAT Score vs Percentile (2021–2025)
Viewing multiple years side by side highlights how much paper difficulty swings the score-to-percentile relationship.
| Year | 99 Percentile Score | 95 Percentile Score | Highest Recorded Score |
|---|---|---|---|
| 2021 | ~92 | ~55 | ~132 |
| 2022 | ~88 | ~50 | ~128 |
| 2023 | ~76 | ~45 | ~143 |
| 2024 | ~90 | ~54 | ~130 |
| 2025 | ~85–86 | ~52–58 | ~135 |
The 2023 dip is a good illustration of why fixating on one year’s cutoff is risky: a comparatively easier paper that year pushed the 99 percentile mark down to roughly 76, well below the 85–90 range seen in surrounding years.
How to Set a Realistic Target Score for CAT 2026
Rather than chasing a fixed number, the smarter approach is to build a target range based on the percentile your shortlisted B-schools actually require, then reverse-engineer a marks target using recent trend data with a safety margin of 5–10 marks.
Attempt vs Accuracy Strategy
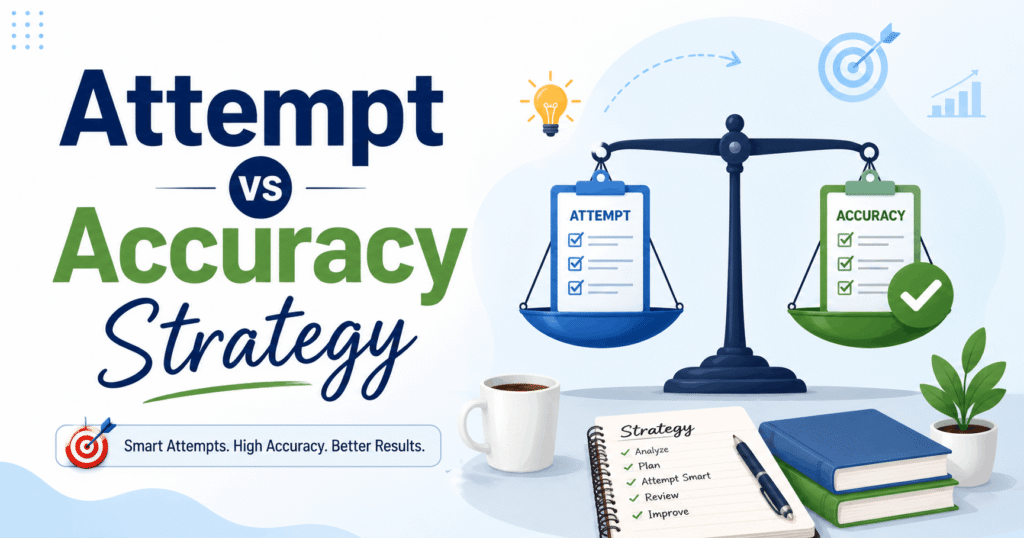
One pattern that shows up consistently across trend analyses: candidates who attempt fewer questions with higher accuracy consistently outperform those who attempt more questions with lower accuracy. Because of the +3/-1 marking scheme, a wrong answer doesn’t just cost you the mark you missed — it costs you the mark you could have earned, a net swing of 4 points per mistake. Attempting around 40–44 questions overall at 85–90% accuracy tends to produce a higher scaled score than attempting 55+ questions at 65–70% accuracy.
Key Takeaways
- CAT Score is your normalized, scaled performance number; CAT Percentile is your relative rank against all test-takers that year.
- Percentiles are calculated from scaled scores, never raw scores — normalization exists to offset slot-difficulty differences.
- For CAT 2026, early estimates suggest roughly 83–90 marks for a 99 percentile, though this will vary based on actual paper difficulty.
- CAT 2025 data showed a 99 percentile at approximately 85–86 marks, a useful anchor for 2026 planning.
- Sectional cutoffs matter as much as the overall score — don’t neglect any of VARC, DILR, or QA.
- Prioritizing accuracy over attempt volume is a proven strategy given CAT’s negative marking structure.
Frequently Asked Questions (FAQ)
Q1. How many marks are needed for a 99 percentile in CAT 2026?
Based on early trend estimates, a scaled score of roughly 83–90 marks is likely to correspond to a 99 percentile in CAT 2026, though the exact figure depends on that year’s paper difficulty and candidate pool performance.
Q2. What is the difference between CAT score and CAT percentile?
CAT score (or marks) is your normalized, absolute performance number, while CAT percentile is a relative ranking showing what proportion of test-takers you outperformed. Two candidates with the same score in different years can end up with different percentiles.
Q3. Does the CAT scorecard show my raw score?
No. The official CAT scorecard displays only your normalized scaled score and percentile — your raw, pre-normalization score is never published.
Q4. Why did CAT 2023 have a lower score requirement for 99 percentile compared to other years?
CAT 2023’s overall paper difficulty was comparatively lower, which pushed up scores across the board and, through normalization, lowered the marks threshold needed to reach the 99th percentile that year to around 76.
Q5. Is CAT percentile the same across all exam slots?
The percentile scale itself is standardized across slots, but the raw-to-scaled score conversion differs by slot to account for difficulty variation. This normalization ensures a candidate isn’t disadvantaged simply because their slot’s paper happened to be harder.
Conclusion: Plan by Percentile, Not by a Fixed Number
The single biggest mindset shift for CAT 2026 aspirants is this: stop chasing a fixed marks target and start planning around the percentile your target B-schools require. Use the CAT Score vs Percentile 2025 and historical trend data in this guide as a directional anchor, build in a safety margin, and prioritize accuracy-driven attempts over sheer volume. Once CAT 2026 results are declared, revisit the official normalization data to fine-tune your understanding — but your preparation strategy should be built around percentile targets from day one, not a single number that could shift with paper difficulty.
You May Also Like : CAT MOCK, CAT MOCK PYQ
Follow Us On : Facebook, Instagram