
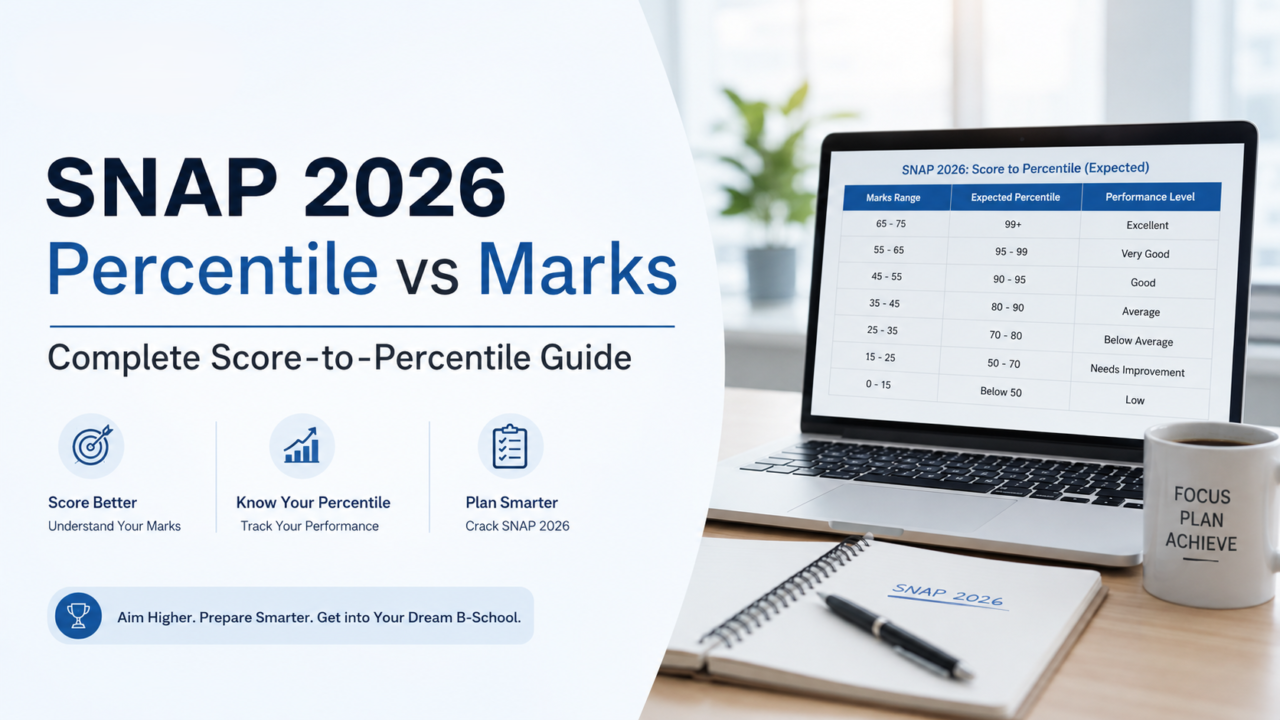
Every MBA aspirant preparing for the Symbiosis National Aptitude Test eventually asks the same question: how do raw marks actually turn into a percentile? Understanding SNAP percentile vs marks is essential because Symbiosis institutes never publish cutoffs in raw score terms — they publish them in percentile terms. Consequently, knowing exactly how your score converts into a percentile helps you set a realistic target, track your preparation, and predict your admission chances well before results are declared.
This guide breaks down the SNAP marking scheme, explains the exact percentile formula, and lays out year-wise score-to-percentile tables so you can benchmark your performance instantly. Whether you’re aiming for SIBM Pune, SCMHRD, or SIIB, this article gives you a single, reliable reference point.
Unlike a typical percentage-based exam, SNAP measures performance relatively, which means your final outcome depends as much on how other candidates perform as it does on your own accuracy. That’s precisely why so many aspirants search for a clear SNAP percentile vs marks breakdown before finalizing their target score. Instead of relying on scattered data across multiple sources, this article brings the formula, historical trends, sectional cutoffs, and college-wise benchmarks together in one structured place, so you can plan your preparation with clarity and confidence.
What Is SNAP Score and What Is SNAP Percentile?
Before comparing SNAP percentile vs marks, it helps to separate the two terms clearly, since candidates often confuse them.
SNAP Score Explained
The SNAP score, also called the raw score, is simply the total marks a candidate earns out of 60. The exam awards +1 mark for every correct answer and deducts 0.25 marks for every incorrect answer, while unattempted questions carry no penalty. For example, a candidate who attempts 48 questions, answers 38 correctly, and gets 10 wrong would score 38 − (10 × 0.25) = 35.5 marks out of 60. This raw number reflects accuracy and speed but says nothing about how the candidate performed relative to peers.
Many aspirants use a SNAP score calculator during preparation to estimate this raw number after every mock test. Doing so regularly is useful because it helps you track improvement over time, independent of how tough or easy a particular mock happens to be. However, remember that the raw score alone cannot predict your admission chances — it only becomes meaningful once converted into a percentile.
SNAP Percentile Explained
The SNAP percentile, on the other hand, is a relative ranking metric. It indicates the percentage of candidates who scored equal to or lower than a particular candidate. So, if you achieve a 95 percentile, it means you performed better than 95% of everyone who appeared for the exam that year. Because percentile depends on the performance of the entire candidate pool, the same raw score can produce different percentiles across different years, sessions, or slots.
SNAP Marking Scheme 2026
Since the marking scheme directly influences how marks translate into percentile, candidates should understand the sectional structure before analyzing the score-to-percentile relationship.
| Section | Approx. Questions | Marks per Correct Answer | Negative Marking |
| General English | 15 | +1 | −0.25 |
| Quantitative, Data Interpretation & Data Sufficiency | 20 | +1 | −0.25 |
| Analytical & Logical Reasoning | 25 | +1 | −0.25 |
| Total | 60 | 60 Marks Max | — |
Accuracy plays a decisive role here because negative marking penalizes guesswork. As a result, candidates who balance speed with precision typically achieve a stronger percentile than those who attempt every question indiscriminately.
How SNAP Percentile Is Calculated (Formula + Example)
The exact formula used to convert rank into percentile is:
SNAP Percentile = [(Total Candidates − Candidate’s Rank) ÷ Total Candidates] × 100
For instance, suppose 60,000 candidates appear for SNAP, and a particular candidate secures rank 6,000. Applying the formula:
SNAP Percentile = [(60,000 − 6,000) ÷ 60,000] × 100 = 90 percentile
This means the candidate outperformed 90% of the entire test-taking population. Notably, because rank — not raw score — drives this formula, percentile can shift even if your score stays the same, simply because the overall difficulty or competition level changes.
SNAP Percentile vs Marks 2026: Year-Wise Comparison Table
The table below consolidates the expected SNAP marks vs percentile trend across recent years, giving you a quick benchmark for where your score is likely to land.
| Percentile Range | Marks Required (2026 Expected) | Marks Required (2025) | Marks Required (2023) |
| 99+ Percentile | 45–50+ | 44–50 | 45+ |
| 97–99 Percentile | 41–44 | 37–44 | 42–45 |
| 94–97 Percentile | 37–40 | 37–41 | 39–42 |
| 90–94 Percentile | 33–36 | 29–39 | 35–39 |
| 80–90 Percentile | 29–32 | 25–29 | 30–34 |
| 70–80 Percentile | 24–28 | 20–25 | 25–29 |
Note: These figures are estimates based on historical trends and previous-year analysis. Actual cutoffs depend on exam difficulty, total candidates, and the normalization process for that specific year.
As the table shows, the marks-to-percentile relationship isn’t fixed — it moves depending on how many candidates appear and how tough that year’s paper is. Therefore, treating these numbers as a directional benchmark, rather than an exact guarantee, is the smarter approach.
SNAP Marks vs Percentile: Section-Wise Breakup for Top Percentiles
Sectional performance often determines whether a candidate crosses the 99th percentile threshold. The following table highlights the approximate section-wise marks that high scorers typically achieve.
| Section | Marks for 90+ Percentile | Marks for 95+ Percentile | Marks for 99+ Percentile |
| General English | 7–9 | 9–11 | 11–13 |
| Quantitative Ability & DI | 10–13 | 13–16 | 16–19 |
| Logical & Analytical Reasoning | 12–15 | 15–18 | 18–21 |
Interestingly, Logical Reasoning tends to carry the most weight when it comes to separating top scorers from the rest, since candidates who excel in this section are more likely to reach the 99th percentile bracket.
SNAP Percentile vs Marks: College-Wise Cutoff Targets
Because Symbiosis-affiliated institutes each set their own percentile cutoffs for Group Exercise, Writing Ability Test, and Personal Interview shortlisting, it’s worth mapping percentile requirements to specific colleges.
| Institute | Minimum Percentile Required | Approximate Marks Needed |
| SIBM Pune | 98–98.5+ | 45+ |
| SCMHRD Pune | 95–97+ | 40–44 |
| SIIB Pune | 90+ | 35–39 |
| SIBM Bengaluru | 90+ | 35–39 |
| Other SIU Institutes | 70–85+ | 24–32 |
Since these numbers fluctuate year to year, cross-checking the latest official cutoff release alongside this table gives a more accurate picture of your admission chances.
Factors That Affect the SNAP Percentile vs Marks Relationship
Several variables influence how a given raw score converts into a percentile, and understanding them helps explain why the same marks don’t always yield identical results.
- Total number of candidates — A larger applicant pool intensifies competition, which can push up the marks needed for the same percentile.
- Difficulty level of the slot — Because SNAP runs across multiple test sessions, a comparatively easier slot may inflate scores across the board, indirectly raising the percentile threshold.
- Normalization process — SNAP applies an equalization method across sessions so that no candidate is disadvantaged by attempting a tougher slot.
- Accuracy versus attempts — Since negative marking penalizes wrong answers, candidates with fewer but more accurate attempts often outperform those who attempt more questions carelessly.
- Category-wise variation — General, OBC, SC, ST, and PwD candidates may face different effective cutoffs at certain institutes, even though the overall percentile calculation formula remains the same for everyone.
- Section-wise weightage at the shortlisting stage — Some institutes weigh sectional scores differently during Group Exercise and Personal Interview shortlisting, which means a balanced performance across all three sections is often safer than excelling in just one.
Why Normalization Matters
Because SNAP is conducted across multiple test sessions and slots, no two candidates necessarily answer identical questions. To ensure fairness, Symbiosis applies an equalization process that adjusts raw scores based on the relative difficulty of each slot before final percentiles are calculated. In practice, this means two candidates with the same raw score in different slots could end up with slightly different percentiles — one more reason why percentile, not raw score, remains the true measure of performance.
Common Mistakes That Hurt SNAP Percentile
Even well-prepared candidates sometimes lose percentile points due to avoidable errors. Recognizing these early can protect your final score.
- Over-attempting out of anxiety: Rushing to attempt every question often increases wrong answers, and each wrong answer directly reduces your raw score by 0.25 marks.
- Ignoring weaker sections entirely: Skipping an entire section to save time can hurt your sectional balance, which some institutes consider during shortlisting.
- Skipping mock analysis: Simply taking mocks without reviewing mistakes limits improvement, since the real learning happens during the review phase, not the test itself.
- Misjudging time allocation: Spending too long on a few difficult questions can eat into time needed for easier, scoring questions elsewhere in the paper.
SNAP Percentile Trend: Why It Changes Every Year
Looking back at the last few SNAP cycles reveals an important pattern: the marks required for the same percentile have generally risen year over year. In 2022, for example, roughly 40 marks were enough to touch the 99th percentile, whereas by 2023 the same percentile demanded 45 or more marks. This upward shift happened largely because the number of test-takers increased significantly while the paper itself became comparatively easier, pushing the entire score distribution higher.
This trend matters for aspirants preparing for the current cycle because it suggests that setting your target purely on last year’s numbers can be risky. Instead, it’s wiser to prepare for a slightly tougher benchmark than the previous year’s cutoff, since competition in SNAP has consistently intensified rather than eased. In other words, treating historical data as a floor rather than a ceiling is a safer preparation strategy.
How to Improve Your SNAP Score and Percentile
Improving your percentile isn’t just about attempting more questions — it’s about attempting the right ones accurately. Start by identifying your strongest section and building speed there first, since early confidence often carries through the rest of the test. Next, prioritize accuracy over volume; skipping uncertain questions is usually smarter than guessing, given the 0.25-mark penalty. Additionally, regular mock tests under timed conditions help you internalize the pacing needed to complete all three sections without rushing. Finally, reviewing your mock test analysis after every attempt allows you to convert weak areas into strengths well before the actual exam.
It also helps to simulate real exam conditions during the final few weeks of preparation. Sitting for a full-length mock in one uninterrupted 60-minute block, without pausing or checking answers midway, trains your mind to manage pressure the same way you will on exam day. Furthermore, tracking your percentile trend across consecutive mocks — rather than focusing on a single score — gives a more reliable indication of whether your preparation is genuinely improving or simply fluctuating with mock difficulty. Combining this data-driven approach with focused revision of weak topics is, in most cases, the fastest route to a higher SNAP percentile.
SNAP Percentile vs Marks: Quick Summary
| Key Metric | Details |
| Maximum Marks | 60 |
| Marking Scheme | +1 correct, −0.25 incorrect |
| Percentile Formula | [(Total Candidates − Rank) ÷ Total Candidates] × 100 |
| 99 Percentile Benchmark | Approx. 45+ marks |
| 90 Percentile Benchmark | Approx. 33–36 marks |
| Top Institute Requirement | SIBM Pune: 98.5+ percentile |
Frequently Asked Questions (FAQs)
Q1. What is the difference between SNAP score and SNAP percentile?
The SNAP score is your raw total out of 60 marks, whereas the SNAP percentile reflects your relative rank compared to every other candidate who appeared for the exam.
Q2. How many marks are required for a 99 percentile in SNAP?
Based on recent trends, candidates generally need 45 or more marks to secure a 99 percentile, though this can shift slightly depending on that year’s difficulty and competition levels.
Q3. What score is needed for a 90 percentile in SNAP?
A score in the range of 33 to 36 marks out of 60 typically results in a 90 percentile, though this benchmark moves year to year based on the overall candidate pool.
Q4. Does the same SNAP score always give the same percentile every year?
No. Since percentile depends on rank relative to all candidates, the same raw score can produce a different percentile depending on the exam’s difficulty and the number of test-takers that year.
Q5. How is SNAP percentile calculated?
SNAP percentile is calculated using the formula: [(Total Candidates − Candidate’s Rank) ÷ Total Candidates] × 100, which converts your rank into a relative percentage.
Q6. What percentile is required for SIBM Pune admission?
SIBM Pune typically requires a percentile of 98 to 98.5 or higher, which usually corresponds to a raw score of around 45 marks or above.
Q7. Why does negative marking matter for SNAP percentile? Because incorrect answers deduct 0.25 marks each, careless attempts can lower your raw score and, consequently, your rank and percentile — making accuracy just as important as speed.
Q8. Can two candidates with the same SNAP score get different percentiles?
Yes, this can happen because SNAP is conducted across multiple slots, and normalization adjusts scores based on each slot’s relative difficulty before final percentiles are calculated.
Q9. Is SNAP percentile the same as SNAP percentage?
No, these are different metrics entirely. Percentage reflects the proportion of marks scored out of the total, while percentile reflects your relative standing compared to all other candidates.
For the full SNAP 2026 roadmap — pattern, syllabus, dates, registration, and cutoffs — see our SNAP 2026 Complete Guide.
Conclusion
Ultimately, understanding SNAP percentile vs marks equips you to prepare strategically rather than guess your way through exam day. While raw marks tell you how many questions you answered correctly, percentile tells you where you actually stand among thousands of competitors — and that’s the number Symbiosis institutes care about most. By using the tables, formula, and college-wise targets in this guide, you can set a realistic score goal, track your mock test progress against real benchmarks, and walk into the SNAP exam with a clear, data-backed target in mind. As you continue preparing, revisit this comparison regularly, since even small accuracy improvements can shift your percentile meaningfully once negative marking and relative ranking come into play.
Follow ups:- Facebook Instagram