
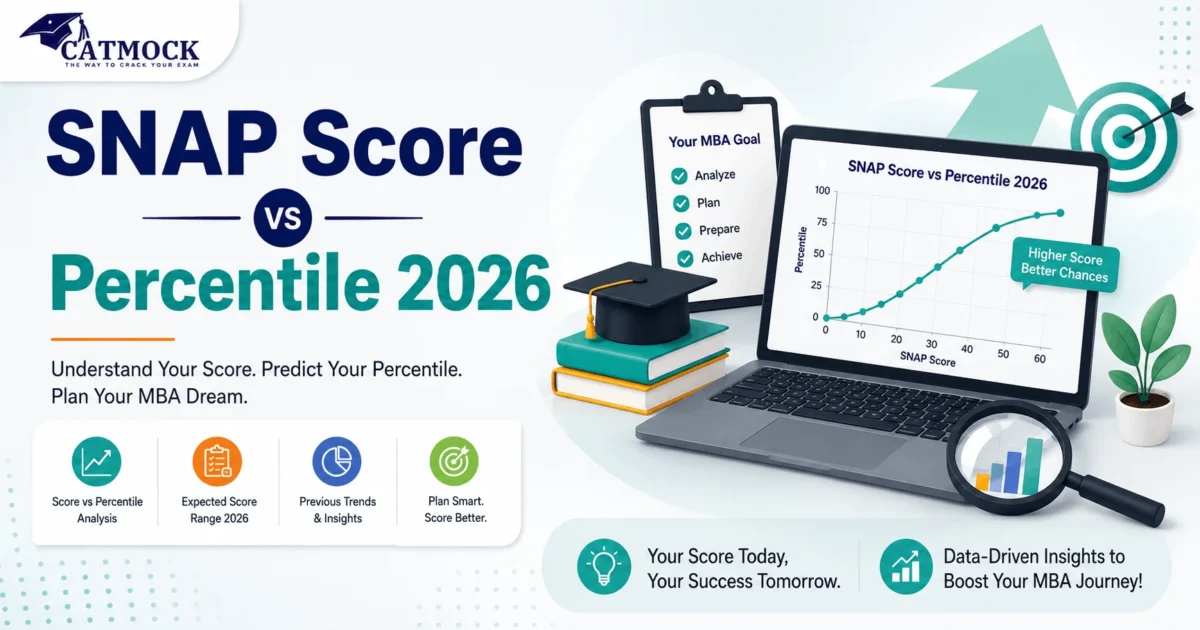
Your SNAP scorecard shows a raw score out of 60, but every Symbiosis institute’s cutoff is set in percentile — and the two don’t move together in any fixed way. A 42 might mean the 96th percentile one year and the 91st the next.
Big update first: SNAP 2026 isn’t the same exam as SNAP 2025. A new section, Ethics, Morality and Values, has been added, and question counts across the other sections have changed too. This guide is fully updated to reflect that.
Want to see where you stand? Try a full-length mock in CATMock’s SNAP practice category.
SNAP 2026 Exam Pattern: What Changed
Per the official SNAP 2026 test structure, SNAP now has four sections instead of three.
| Section | SNAP 2025 | SNAP 2026 |
|---|---|---|
| General English | 15 Q | 10 Q |
| Analytical & Logical Reasoning | 25 Q | 20 Q |
| Quant, DI & Data Sufficiency | 20 Q | 20 Q |
| Ethics, Morality and Values | — | 10 Q (new) |
| Total | 60 Q / 60 marks | 60 Q / 60 marks |
Marking is unchanged: +1 for correct, −0.25 for wrong, no penalty for skipped questions, 60 minutes overall with no fixed sectional timer.
Quick takeaway: English and Reasoning both lost 5 questions each, and that space went into the new Ethics section. Quant stayed the same.
What Will the Ethics Section Test?
SIU hasn’t released a topic list yet, and no real paper has been conducted, so nothing here is confirmed. Expect a mix of workplace ethical-dilemma questions, values-based reasoning, and general judgment scenarios — similar to what other management exams test. Treat this as a smart guess, not a fixed syllabus, until the first test day gives us real data.
SNAP 2026 Official Dates
Confirmed directly from snaptest.org:
| Event | Date |
|---|---|
| Registration Opens | August 21, 2026 |
| Registration Closes | November 25, 2026 |
| SNAP 01 Test | December 13, 2026 |
| SNAP 02 Test | December 19, 2026 |
| SNAP 03 Test | December 26, 2026 |
| Result | January 12, 2027 |
You can appear for up to three tests; only your best score counts.
Score vs Percentile: The Basic Difference
| Score | Percentile | |
|---|---|---|
| What it is | Raw marks out of 60 | Your rank compared to everyone else |
| Used for admission? | No | Yes — every institute’s cutoff is in percentile |
| Changes yearly? | Same scale each year | Yes, based on that year’s difficulty and applicant pool |
SNAP doesn’t normalise scores across test days like CAT does — your percentile depends purely on how many candidates you outscored across all three sessions combined. With a brand-new section this year, that comparison pool includes a section nobody has prior data on, so scores could distribute differently than in past years.
SNAP 2025 Score vs Percentile (Last Year, Old Pattern)
| Score (out of 60) | Approx. Percentile |
|---|---|
| 52+ | 99.9+ |
| 45 – 51 | 99.5 – 99.8 |
| 41 – 44 | 97 – 99 |
| 37 – 40 | 94 – 97 |
| 29 – 36 | 80 – 90 |
| 25 – 28 | 65 – 75 |
Based on released SNAP 2025 scorecards. This reflects the old three-section format — use it as a reference point, not an exact prediction for 2026.
Three-Year Trend (2023–2025)
| Percentile Target | 2023 | 2024 | 2025 |
|---|---|---|---|
| 99 percentile | 45+ | 40+ | 41 – 44 |
| 95 percentile | 40+ | 35 – 39 | 37 – 40 |
| 90 percentile | ~35 | 30 – 34 | 29 – 36 |
| 75 – 85 percentile | ~30 | 25 – 29 | 25 – 28 |
Note: SNAP moved from a 110-question, 130-minute format to the current 60-question format in 2024, and now to a four-section format in 2026. Don’t compare raw scores directly across these different formats — only compare percentiles.
Why the Same Score Gives a Different Percentile Each Year
- Total number of candidates that year
- Overall difficulty of the paper
- How many candidates score near the top
- Which of your (up to 3) attempts counts — only the best one does
- New for 2026: the untested Ethics section could shift the whole score distribution
Aim comfortably above the historical score band for your target percentile, and build in extra buffer this year given the pattern change.
Institute-Wise Cutoffs (Directional, Based on SNAP 2025)
| Institute | Expected Cutoff (General) |
|---|---|
| SIBM Pune | ~98 – 98.5 |
| SIBM Nagpur | ~97 – 98.5 |
| SCMHRD Pune | ~96 – 97 |
| SIIB Pune | ~90 – 93 |
| SIBM Bengaluru | ~90 – 93 |
| Other SIU institutes | ~73 – 88 |
These are shortlisting cutoffs for GE-WAT-PI, not guaranteed admission.
Category-Wise Relaxation
| Category | Typical Cutoff Range |
|---|---|
| General | 90 – 98.5 percentile |
| OBC | 70 – 92 percentile |
| SC | 50 – 70 percentile |
| ST | Below the SC band |
| PwD | Extra relaxation on top of category band |
Reservation norms follow UGC guidelines. SIBM Pune reserves roughly 15% SC, 7.5% ST, 3% PwD seats.
Section-Wise Scoring: What Needs Rethinking for 2026
Under the old pattern, top scorers (99+ percentile) typically got 7–10 marks in English, 17–21 in Reasoning, and 6–14 in Quant. This exact split won’t hold in 2026 since Reasoning and English now carry fewer questions.
Practical guidance for the new pattern:
- Reasoning (20 Q) is still the single largest section — worth prioritizing.
- Quant (20 Q) is unchanged — keep the same prep approach.
- English (10 Q) now has a lower scoring ceiling than before.
- Ethics (10 Q) is a wildcard — no fixed syllabus yet, so focus on calm, logical reasoning under time pressure rather than memorizing content.
What’s a “Good” SNAP Score in 2026?
| Score Band (out of 60) | Likely Outcome |
|---|---|
| 45+ | SIBM Pune, SIBM Nagpur, SCMHRD Pune (99th percentile) |
| 37 – 44 | SCMHRD, SIIB Pune, SIBM Bengaluru (94–97th percentile) |
| 29 – 36 | SIIB Pune, SIBM Bengaluru, mid-tier institutes (80–90th percentile) |
| Below 29 | Lower-tier institutes, subject to category relaxation |
Aim for the top of your target band this year — the new section adds real uncertainty to how scores will spread. You can also check an institute’s standing via the NIRF ranking framework.
Common Misconceptions
- “45/60 always means 99 percentile.” No — it shifted every year even before the pattern change.
- “SNAP 2026 is the same as SNAP 2025.” It’s not — new section, new question counts.
- “SNAP normalises scores across test days like CAT.” It doesn’t — raw scores are compared directly.
- “Clearing the cutoff guarantees admission.” It only gets you a GE-WAT-PI call.
- “All three attempts are averaged.” Only your best attempt counts.
- “Pre-2024 score data is still useful.” No — the format has changed twice since then; compare percentiles, not raw scores, across format changes.
Timeline Summary
Registration: Aug 21 – Nov 25, 2026. Tests: Dec 13, 19, 26, 2026. Result: Jan 12, 2027. GE-WAT-PI rounds typically follow through February–March 2027.
Since only your best attempt counts, appearing early (Dec 13) gives you a real data point to improve on in later attempts. Always confirm dates on the official SNAP site, as SIU can revise the schedule.
Key Takeaways
- SNAP 2026 has 4 sections: English (10), Reasoning (20), Quant (20), Ethics, Morality & Values (10, new) — still 60 marks, 60 minutes.
- Confirmed dates: tests on Dec 13, 19, 26, 2026; result on Jan 12, 2027; registration closes Nov 25, 2026.
- SNAP doesn’t normalise scores across test days — percentile depends on the full applicant pool.
- The score-to-percentile mapping shifts every year, and this year it shifts more due to the new section.
- Only your best of up to 3 attempts counts.
- Institute cutoffs (SIBM Pune ~98+, SCMHRD ~96–97, SIIB/SIBM Bengaluru ~90–93) are directional, not guaranteed.
FAQs
1. Is a 40/60 a good SNAP score for 2026?
Under the old pattern, 40 usually meant 94–97th percentile. Treat this as a rough guide only, since the new Ethics section could shift how scores spread this year.
2. What is the new Ethics, Morality and Values section?
A new 10-question section added for SNAP 2026. No official topic list exists yet — prepare with general values-based and situational-judgment practice.
3. Why did my friend get a higher percentile with a lower score?
Percentiles depend on the full applicant pool, not just your own score — different attempts or years can have different difficulty levels.
4. Does SNAP have sectional cutoffs?
Most institutes, including SIBM Pune, have historically used only an overall cutoff — but confirm with each institute this year, given the new section.
5. What are the official SNAP 2026 dates?
Tests on December 13, 19, and 26, 2026; result on January 12, 2027; registration closes November 25, 2026. Source: snaptest.org.
6. Should I retake SNAP if my first score is borderline?
Yes — retaking costs only the fee, and there’s no downside since your best score counts. This matters even more in 2026, when one attempt is harder to benchmark confidently.
Conclusion
SNAP’s score-to-percentile link was never fixed, and 2026 makes that truer than ever with a new section and rebalanced sections. Use the trend data here as a guide, aim above your target cutoff, and always confirm final cutoffs against each institute’s own shortlist after results on January 12, 2027.
Start a free full-length SNAP mock on CATMock to see where your score would land under the new pattern.
References
Compiled from released SNAP scorecards and admissions-research analysis, cross-checked against SNAP 2026 Test Structure and SNAP 2026 Important Dates. Always confirm current cutoffs with snaptest.org and each institute directly. Broader context: UGC, Ministry of Education, NIRF.